
The landscape of higher education in the United States has undergone significant demographic shifts over the past decade. Understanding these trends is crucial for navigating the evolving world of college admissions and campus diversity. Let’s explore key insights revealed by recent IPEDS data on undergraduate enrollment from 2011 to 2022.
Racial and Ethnic Diversity on the Rise
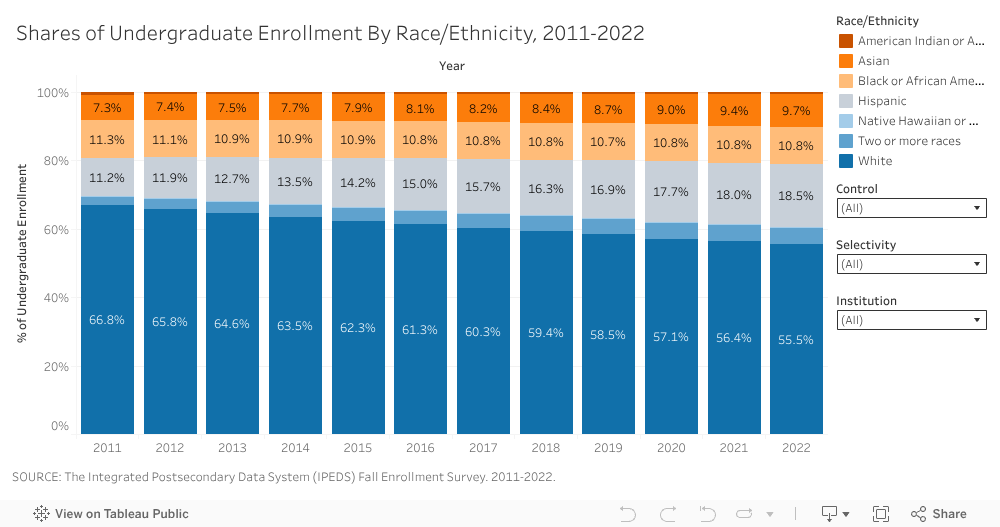
The most striking change over the past decade has been the steady increase in racial and ethnic diversity on college campuses. As shown in the first visualization, the share of white students has declined notably, from 66.8% in 2011 to 55.5% in 2022. This shift has been accompanied by growth in other racial and ethnic groups:
- Hispanic student enrollment has seen the most substantial increase, rising from 11.2% to 18.5%
- Asian student enrollment grew from 7.3% to 9.7%
- Black or African American student enrollment increased slightly from 11.3% to 10.8%
These changes reflect broader demographic shifts in the U.S. population and highlight the increasing importance of diversity initiatives on campuses nationwide. For example, efforts at the University of California Berkeley resulted in a substantial increase in Hispanic student enrollment, which grew from 14% to 24% during this period, mirroring the national trend.
Gender Balance Remains Relatively Stable
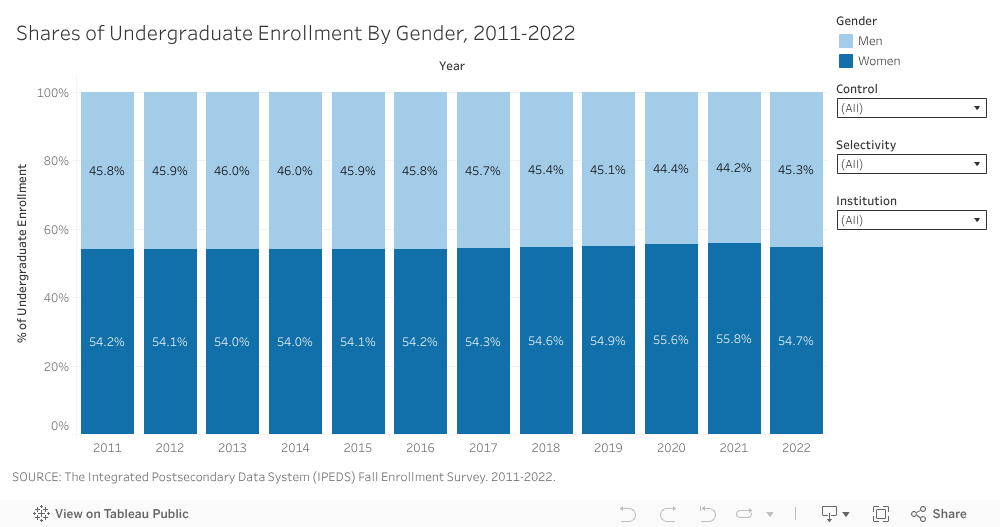
In contrast to the significant shifts in racial composition, the gender balance in higher education has remained relatively constant over the same period. The second chart reveals that women have consistently made up the majority of undergraduate students, with their share hovering between 54-55% throughout the decade.
This stability in gender representation may influence campus cultures, academic programs, and extracurricular offerings across institutions. However, it’s important to note that gender balance can vary significantly across different fields of study. For instance, Georgia Institute of Technology has seen changes in gender diversity in traditionally male-dominated fields like engineering. Female enrollment at Georgia Tech increased from 32.2% in 2011 to 39.8% in 2021, before experiencing a slight decrease in 2022. This trend reflects shifting gender demographics in a prominent technical institution.
Quantifying Diversity: The Simpson’s Diversity Index
To gain a more comprehensive understanding of campus diversity, many researchers and institutions turn to metrics like the Simpson’s Diversity Index. This powerful tool provides a single numerical value to represent the diversity of a population, taking into account both the variety of groups present and their relative abundances.
The Simpson’s Diversity Index is calculated using the following formula:
D = 1 – (n(n-1)/N(N-1))
Where:
- D is the diversity index
- n is the number of individuals of a particular group (e.g., a race/ethnicity)
- N is the total number of individuals of all groups (e.g., the undergraduate student body)
The resulting value ranges from 0 to 1, where 0 represents no diversity (a single group dominates entirely) and 1 represents infinite diversity (each individual belongs to a unique group). This index is particularly well-suited for analyzing campus diversity as it distills complex demographic data into a single, comparable number.
Insights from the Diversity Index – Institutional Control, Selectivity, and Diversity
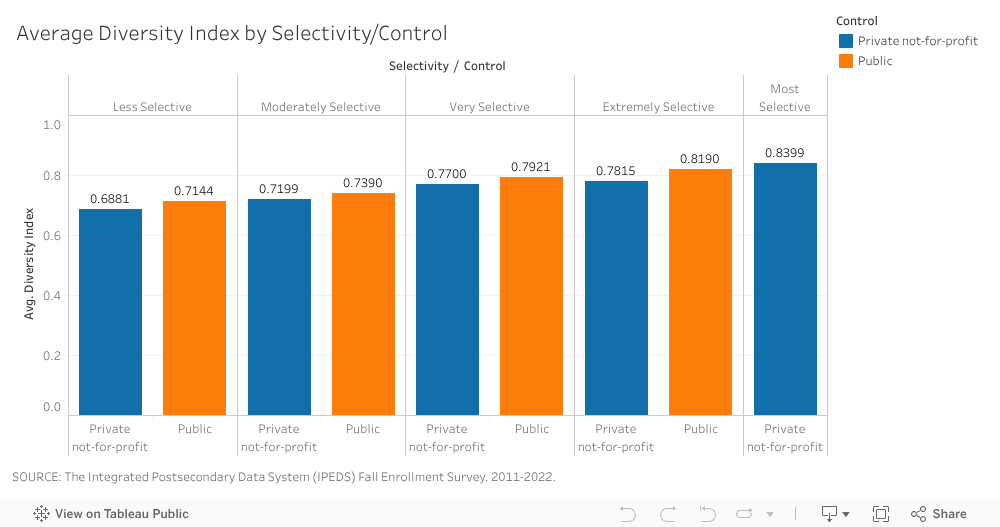
We find that public institutions tend to exhibit higher racial/ethnic diversity compared to their private, not-for-profit counterparts across all selectivity levels. Moreover, the average diversity index increases as selectivity increases, with the most selective schools showing the highest average diversity indices.
Upward Trend in Diversity
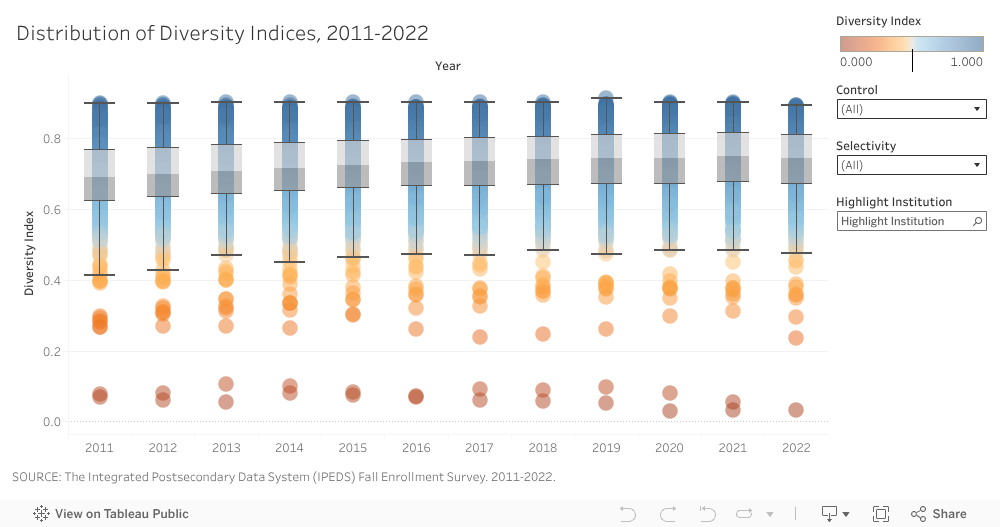
From 2011 to 2022, there’s been a clear upward trend in diversity across all types of institutions. The median diversity index has risen steadily, indicating that the average institution has become more diverse over time. This aligns with the racial and ethnic shifts observed earlier. The range of diversity indices has also expanded, particularly at the upper end. This suggests that while most institutions are becoming more diverse, some are making especially significant strides, potentially through targeted initiatives or changing local demographics. A striking example of this trend is Harvey Mudd College, which increased its diversity index by 14% between 2011 and 2022.
Conclusion
The past decade has seen significant shifts in the demographic landscape of U.S. higher education. Racial and ethnic diversity has increased substantially, with the share of white students declining and Hispanic, Asian, and Black student enrollment rising. Gender balance has remained relatively stable, with women consistently making up the majority of undergraduates. However, some technical institutions have seen notable changes in gender diversity, particularly in traditionally male-dominated fields like engineering.
The Simpson’s Diversity Index provides a powerful tool for quantifying diversity, revealing that private institutions tend to be more diverse than public ones, and that diversity positively correlates with selectivity. From 2011 to 2022, the overall trend has been towards greater diversity across all types of institutions, with some such as Harvey Mudd College, Barnard College, and Vanderbilt University, making particularly impressive strides.
As the U.S. population continues to evolve, it’s crucial for colleges and universities to prioritize diversity and inclusion initiatives to create welcoming, equitable environments for all students. By understanding these demographic shifts and their implications, parents, students, and admissions professionals can better navigate the changing landscape of higher education and work towards a more diverse, inclusive future.
