
In our previous analyses of higher education finance, we explored how tuition trends are more nuanced than commonly portrayed and examined the diverse ways institutions generate revenue. Now, we turn to perhaps the most revealing aspect of institutional priorities: how colleges and universities spend their money. Understanding expenditure patterns provides crucial insights into institutional missions, strategic priorities, and the changing landscape of higher education.
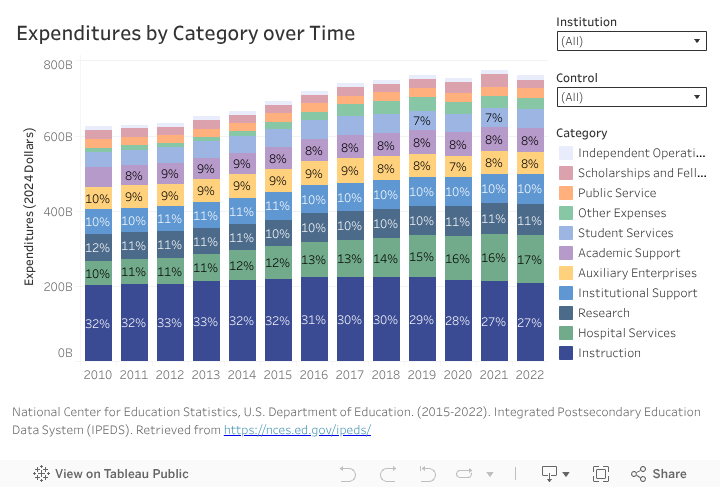
The aggregate spending patterns in American higher education reveal several important trends. Most notably, the share of spending devoted to instruction – the core teaching mission of colleges and universities – has declined steadily from 32% in 2010 to 27% in 2022. Meanwhile, spending on hospital services has grown from 10% to 17% of total expenditures, reflecting the increasing importance of medical operations at many institutions.
This shift prompts important questions about institutional priorities and the changing nature of American higher education. Are colleges and universities moving away from their traditional instructional focus? How do different types of institutions balance competing priorities? The answers, as we’ll see, vary significantly based on institutional mission, resources, and market position.
The Big Picture: Understanding Expenditure Categories
Before diving into specific trends, it’s important to understand what these expenditure categories represent:
- Instruction: Faculty salaries, departmental costs, and other direct teaching expenses
- Research: Both sponsored and institutional research activities
- Hospital Services: Operation of hospitals, clinics, and other healthcare facilities
- Academic Support: Libraries, museums, academic administration
- Student Services: Admissions, registrar, student activities, athletics
- Institutional Support: General administrative services, legal and fiscal operations
- Auxiliary Enterprises: Self-supporting operations like residence halls and dining
- Public Service: Community programs, cooperative extension services
- Scholarships and Fellowships: Aid after deducting tuition and fee allowances
Understanding the Variations: Control, Selectivity, and Mission
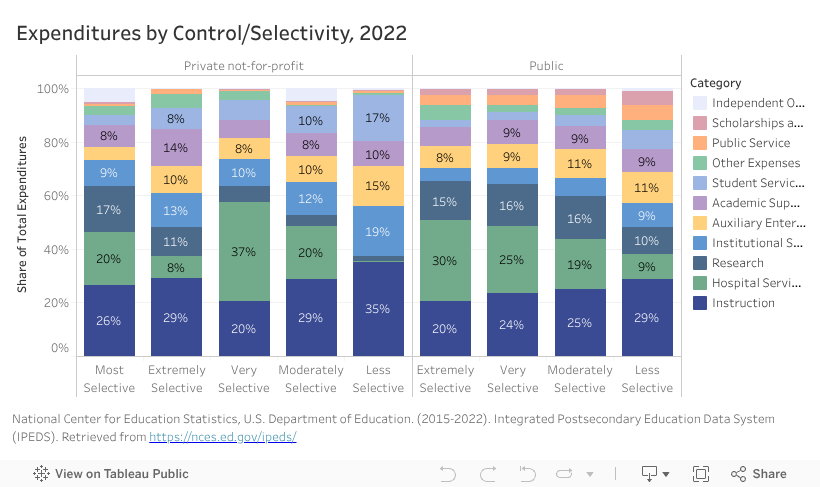
When we examine spending patterns by institutional control and selectivity, several clear patterns emerge:
- Public-Private Differences: Public institutions generally show more consistent spending patterns across selectivity levels compared to private institutions. This might reflect:
- State funding requirements and oversight
- More standardized missions and operational models
- Different approaches to revenue generation (as discussed in Part 2)
- Selectivity Effects: The most selective institutions – both public and private – typically show:
- Higher research expenditures
- More diverse spending portfolios
- Greater investment in student services and institutional support
Mission Matters: Expenditures in Liberal Arts Colleges
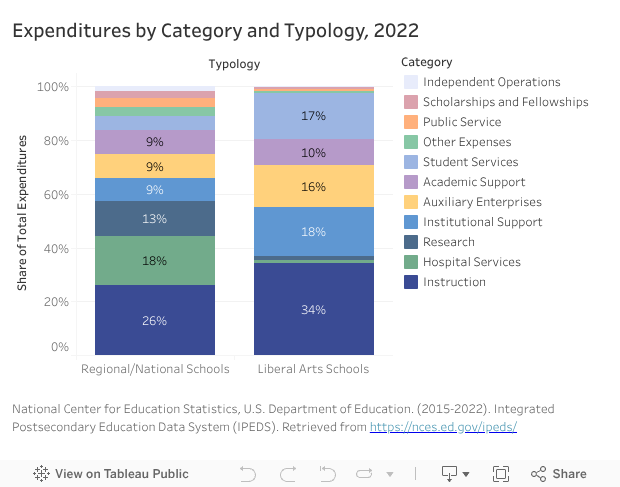
When examining expenditure patterns by institutional control and selectivity, clear patterns emerge. Liberal arts colleges typically devote a larger share of their budgets to instruction (34% vs. 26% for research universities), reflecting their focus on undergraduate education. Meanwhile, regional and national schools, often research universities, show more diversified spending patterns, with significant allocations to research, hospital services, and auxiliary enterprises.
Implications and Looking Ahead
These institutional examples illustrate broader patterns in higher education spending. We encourage readers to explore these patterns using our interactive visualizations. Try selecting different institutions or filtering by control and selectivity to uncover your own insights.
Several key patterns emerge from the data:
- Mission Drives Spending: An institution’s core mission strongly influences its spending priorities. Liberal arts colleges consistently prioritize instruction and student services, while research universities maintain more diverse expenditure portfolios.
- Medical Operations Transform Budgets: Universities with major medical centers show dramatically different spending patterns from their peers. The University of Rochester provides perhaps the most striking example, with hospital services growing to account for 77% of total expenditures.
- Research Investment Varies by Selectivity: More selective institutions typically devote larger shares of their budgets to research, reflecting both their missions and their ability to attract external funding.
- Public-Private Differences: Public institutions show more consistent spending patterns across selectivity levels, while private institutions display greater variation. This likely reflects both state oversight of public institutions and the greater autonomy of private colleges and universities.
These patterns connect directly to our earlier discussion of revenue sources. Institutions with diverse revenue streams – like major research universities and those with medical centers – typically show more complex spending patterns. Meanwhile, tuition-dependent institutions often maintain more focused expenditure profiles centered on instruction and student services.
Conclusion
This analysis of spending patterns completes our three-part examination of higher education finance. From tuition trends to revenue sources to expenditure patterns, we’ve seen how American colleges and universities adapt to changing circumstances while pursuing distinct missions.
The story that emerges is one of increasing complexity and differentiation. While common trends – like declining instructional spending and growing auxiliary services – affect most institutions, the specific responses vary significantly based on institutional type, resources, and mission.
We encourage readers to explore these patterns further using our interactive visualizations. Understanding how institutions allocate their resources provides crucial context for discussions about college costs, access, and quality. As the higher education landscape continues to evolve, these spending patterns will likely continue to shift, reflecting both external pressures and institutional choices about priorities and mission.
